在终端绘制GPU显存使用曲线
发布于
在终端绘制GPU显存使用曲线
这个东西的灵感来自于写torch的时候想实时看到loss和gpu使用情况,突然想到可以在终端实时显示,经过与ai的一番激烈讨,最终有了这个代码。
我们首先要获取GPU的显存使用数据,先检查是否安装了nvidia-smi, 在终端输入有正常输出即可。
首先导入所有需要的库
import subprocess
import time
import asciichartpy
import platform通过nvidia-smi 的命令获取已经使用的显存和所有现存
def get_gpu_used_memory():
	output = subprocess.check_output(['nvidia-smi', '--query-gpu=memory.used', '--format=csv,nounits'])
	output = output.decode('utf-8')
	lines = output.strip().split('\n')
	used_memory = int(lines[1])
	return used_memory

def get_gpu_total_memory():
	output = subprocess.check_output(['nvidia-smi', '--query-gpu=memory.total', '--format=csv,nounits'])
	output = output.decode('utf-8')
	lines = output.strip().split('\n')
	total_memory = int(lines[1])
	return total_memory
asciichartpy 是一个 Python 库,用于在终端中绘制 ASCII 图表。我们用他来在终端绘制图标。
def draw_gpu_memory(gpu_memory_history):
    used_memory = get_gpu_used_memory()
    total_memory = get_gpu_total_memory()

    used_percentage = used_memory / total_memory * 100
    gpu_memory_history.append(used_percentage)

    # 绘制字符图表
    chart = asciichartpy.plot(gpu_memory_history, {'height': 20, 'width': 10, 'timestamp': True})

    # 清空终端屏幕
    if platform.system() == 'Windows':
        subprocess.call('cls', shell=True)
    else:
        subprocess.call('clear', shell=True)

    print(chart)
最后运行上面的代码
while True:
try:
gpu_memory_history = []
while True:
draw_gpu_memory(gpu_memory_history)
time.sleep(1)
except KeyboardInterrupt:
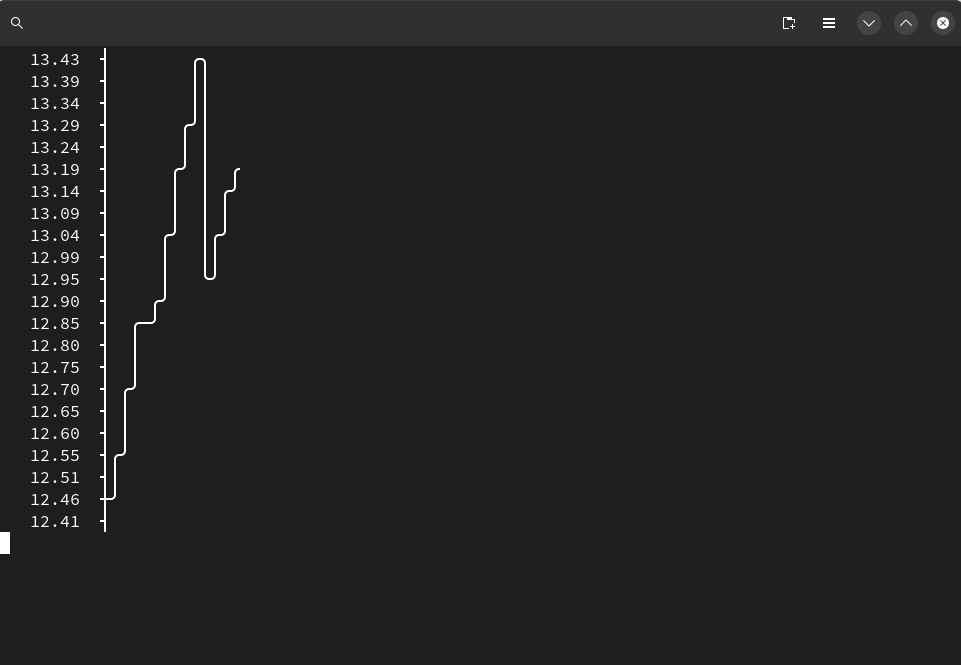
break运行效果